Friday, September 13, 2019

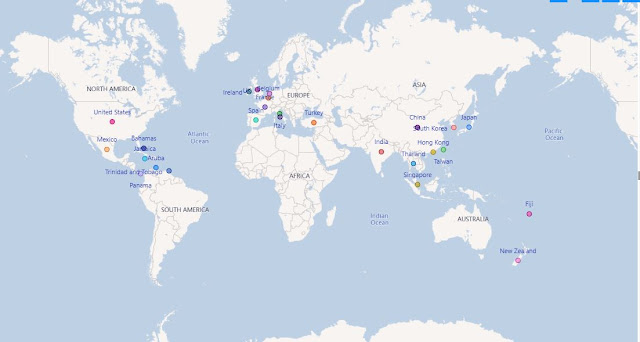
List of territories/countries I have visited

Any one who knows me, knows that I love travelling. Here is a snapshot of the wonderful places I have visited till date. It's fun to mix my two passions data and travel :)

And this is from some weekend I spent analyzing a random data set:
https://public.tableau.com/profile/rajan2085#!/


Travel adventures so far


Monday, August 26, 2019

What do data and analytics consultants do?

"Hey, nice to meet you. So what do you do?" As soon as someone asks me this, I get excited. Why? Because I am eager to tell the person I am conversing with all the amazing things I have worked on, I am currently working on, and could potentially be working on. If you have ever wondered what data analytics consultants do, read on.

You see, when you are a consultant you have opportunity to work with amazing clients and solve their problems using their data and technology. I usually just say "I am a data analytics manager who builds products that provide clients strategic executive insights". However, there is so much more than that I do as a manager in consulting! I wear multiple hats on my projects, and on the same project I would at some point work as a - data product manager, a solutions architect, a project manager, data scientist and a data engineer. How? Well here goes:
Data Product Manager: I define the product requirements after meeting with executives, write stories, review and sign off on work, and own the all aspects related to the product
Solutions Architect: Depending on the project, I provide the solutioning of the product i.e create the data models, define the transformation process, design the prototype dashboard, design and define the metrics
Project Manager: I create and manage the timeline for requirements, development and dev/production testing
Data Scientist: Depending on the project, I may be helping out my team create dashboards and as mentioned earlier I would most definitely be involved in defining the visuals that go into the dashboard
Data Engineer: I am not only involved in defining the data model and transformation but I provide a hand if and when the team is running behind or needs help with a particular piece of SQL code
Team Manager: I am responsible not only for my product but also for the performance and growth people I lead on my team
People Manager: Since consulting teams often change, it's of paramount importance to have someone who you can always report to. I serve as a people manager to some really smart people and this is a role I particularly enjoy

Apart from the roles mentioned above, I am also managing client relationships and helping out in responding to proposals, and recruiting bright and smart talent to do wonderful things we haven't yet thought of!

Now that we have discussed the roles, let's get into what the projects I could work on be:
Data Analytics: Statistical analysis on data to provide predictive/prescriptive analytics. Think Machine learning (regressions etc)
Business Intelligence: Analyze data to provide descriptive analytics on executive dashboards that will be used for high impact decision making
Technology Assessments: Assess the current state of analytics of companies to figure out gaps, issues and risks
Technology Strategy: Usually a step after the technology assessments, define strategies that companies could use to help improve their operations and get more value from their data

Consulting is a fantastic line of work, especially for those early in their career so they can exposed to multiple different industries and clients. On the flip side, you tend to work with different clients all the time so you may not be able to see the impact of all the awesome work your team has done. I feel the biggest advantage of being a consultant sometime in your career is the ability to get the job done - you have to be quick learner and you enjoy new challenges. Now that's as succinct as I can be without writing a book! 
Saturday, September 1, 2018

In-Store Analytics for CPG Industry using Market Research Data

Consumer Packaged Goods can be defined as daily consumable goods. Examples include sodas, juices, candy bars, granola bars etc. Unlike some other countries, say India, the prices of goods differ at different retail stores in the United States of America. In some countries, there is a maximum price printed on products beyond which it is illegal for the sellers to charge. However, in the US it’s a completely different story. A variety of factors are considered by a retailer and a manufacturer to produce, stock, and price products. While it may seem like the most important factors affecting manufacturers and retailers are the demand and supply, and logistics involved; tens if not hundreds of factors are involved. As for pricing products, numerous factors are taken into consideration like the likelihood of buying a product, convenience, quantity, expiry date, size of product,seasonality of product etc. Each factor is extremely important and each decision has a potential to save or lose millions of dollars. I would really love to talk about the hundreds of ways data can be used by retailers and manufacturers but then I would be writing a book! For the sake of this post, I stick to in-store analytics. By in-store I mean the store stocking conditions that are found in stores. Also, I stick to what data can be used and not the method of using it since you could potentially use any data mining technique to extract meaningful information out of this data.
While it may seem rudimentary, in-store analytics is quite profound and has a phenomenal future limited only by the increase in e-commerce. However, there is one big problem with e-commerce associated with CPG – people want things instantly. When a person is hungry, he or she will not go online to buy food – well unless its ordering from Seamless or GrubHub but that’s a different story. Impulse buying is HUGE and you have to agree to that. How often have to gone to a store with a chocolate or chewing gum on your list and also how often do you stick to your list? In-Store analytics is done primarily using the 3 P’s 1) Positioning of products, 2) Placement of products and 3) Prices of products.

1) Positioning of products: Let’s say you are a chocolate company and you have a product called Super Choco. You want to know how your product is stocked in different stores, what is placed next to your product, what is placed above, below, to the right and to the left of your product in what quantity. Once you have this information, you can use the store quantity sales data and see how you fared in different stores. Did particular positioning of a product have a positive or negative effect on your sales? This data is available from  major market research companies. Believe it or not, there are representatives of market research companies who actually go and scan stores to get this data. Once you have this data you can use a data mining model like a decision tree to find what factors resulted in optimal sales and make business decisions based on that.

2) Placement of products: Lets assume you did everything right and your product Super Choco did very well last year. This year you want it to do even better. You want to increase sales and you are willing to spend for it. Companies have a way to “display” products in stores. They can choose what kind of display – Front end, back end, lobby etc, they want for their product at different retailers; for a price. The simplest example of a display is the freezer you find at checkout and the chewing gum section at checkout. Other examples include chips displayed with company symbols on their rack which seem conveniently to be out of place so that you are sure notice them! Now you can display Super Choco and someone like me will see it staring at me while I go to buy my bread. I see it, I like what I see, I buy it. Boom! That’s a sale! Now companies know where to exactly place these products to increase sales. They can have beta testing where in they position products in different stores and see which one worked best for them or have a full blown campaign and use analytics to predict future results.

3) Prices of Products: No introduction needed here. Lower the price, better the sales right? Unfortunately, no. Prices affect our CPG buying only so much. While a store can be perceived as expensive or inexpensive, a number of prices of products in stores fluctuate daily or at least weekly. With market research data a company/retailer can see if prices affected customer’s buying pattern. Let’s say there are two comparable stores, both conveniently located below buildings in downtown Chicago. Super Choco is priced at $1 in building A and $1.75 in building B. At the end of the month, you are likely to see no or little difference in sales since people don’t come to these store just to find your product. It’s only about convenience in this case and you could increase the price of your product as a retailer without any loss in sales. Also, you could use market basket analysis to find out which products are frequently bought together to enable better pricing and positioning.

Friday, January 19, 2018

Marketing Analytics - The Mobile Advertising Models & Ad Networks

I have been reading a lot about marketing and the gaming industry lately and feel its something really cool to blog about. Anyone into marketing or into analytics will find the next few posts quite interesting. Well, at least that is what I hope for!

Every mobile company needs to advertise. Now there are number of ways of doing this. Either have direct partnerships with other companies which own apps, go to Google or Apple or let someone else decide how to get those ad impressions for you.


There are number of ways to advertise - Display CPM, CPC, CPA/CPI, Search CPC are all online advertising models. Each of them varies in their cost structure.

1. Display CPM: CPM is an acronym for Cost per Mille or Cost per thousand. In such a setup the cost of the advertisement is calculated for 1000 page impressions each time the advertisement is displayed. A company which decides to use CPM advertisements will be quoted a guaranteed number of page impressions for an advertisement. The cost structure will be based on the decided number. The cost structure is independent of the visitors clicking the advertisement. Publishers get a share of the revenue.

2. CPC: CPC stands for Cost per Click. In this advertisement model, the publisher is paid each time a visitor clicks on the displayed advertisement. It does not matter what the visitor does after clicking on the ads. These types of ads are monitored to ensure that the publisher does not artificially inflate numbers.

3. CPA: CPA stands for Cost per Acquisition or Action. In this model, the advertiser pays when a certain action criteria is met after a visitor arrives at the advertiser’s link. For, a gaming company this criteria could be a visitor clicking on a link to reach the iTunes store and downloading their game. This model tends to be costly because of the action guarantee associated with it.

4. Search CPC: In this type of mode, advertisers pay a fee for displaying their content shown on search engines. Sometimes the natural results and the paid search results can be easily differentiated by visitors due to the display structure. An advertiser pays only if a customer clicks on an advertisement. The cost associated is higher than content CPC.

CPM is useful for a company that is already established or is in the early stage wherein they have a huge market and want to ensure market visibility. CPC ensures that a visitor at least looks at an advertiser’s link and this would be useful for a gaming company if the visitor is browsing using a mobile device. However, in my opinion the most important of these models for app companies would be Cost per Action since this could ensure that a visitor clicks on a link and downloads the app. As the number of people that download the app increases, the app ranking rises on iTunes and Android Market Search, the number of reviews increase helping the app(a game maybe?) go viral. The higher the k-factor the more successful the adoption of this model would be.

Now how do you get your ad in there??

The two leading mobile ad networks(in my opinion) for iOS would be AdMob and iAd.

1. AdMob: According to AdMob’s website 1,107,009,356,188 global impressions have been served by AdMob. Google AdMob offers a variety of services like Text Ads, Ads with Offers, Click to download etc. They are very well established and these services gel very well with other services offered by Google like AdWords Reporting and Google Analytics. Google AdMob is doing very well and has worked with a number of big brands. One disadvantage Google has is that its competitor Apple owns the iOS platform which might cause problems in the future. But its Google!

2. iAd: iAd is owned by Apple which makes it a good choice for user acquisition on iOS. According to Apple, iAd has installed more than 15 billion applications, it’s audience has activated over 225 million iTunes accounts, spends, on average, 73 minutes per day using apps and engages with iAd ads for an average of 60 seconds per visit. Apple vs Google - Its tough to answer that one!

Both iAd and AdMob have had complains from users and no one network seems significantly better than the other. The spend would be evaluated by looking at the Clicks, Fill Rate, Impressions, eCPM (Effective Cost Per Thousand) and Revenue. In my opinion, the best way to advertise would be to implement “mobclix” or something similar wherein multiple ad networks could be used.

Saturday, January 28, 2017

Basic Data Mining for Customer Segmentation using Logistic Regression

Logistic regression is a data mining technique that is used in banks to determine various things like the risk factor associated with a person. If a customer is above a certain risk limit than services like overdrafts are not extended to the customer. Similar data mining can be done by any marketing company to find out which of their customers are going to pay or are capable of paying for their products - for example for a gaming company that would be paying for playing the game. A combination of a number of variables could lead to giving out this important information – age, sex, location, salary, education etc. Each variable would have a different weight associated with it, where higher weights (coefficients) would represent more important variables. A part of the historical data can be used as training data to get a good estimate of the coefficients and the results can be tested against the rest of the historical data to check the accuracy.

When the results are accurate enough, logistic regression could be used to determine the probability of a customer paying for virtual currency in the next one day/one week/one month etc. Customers could also be segmented according to their paying probability and paying capacity so good decisions could be made on spending on acquisition of these customers. This can also lead to saving a lot of money by cutting down on paying for acquisition of non-paying customers. Similar technique can be used to find influencers and influential people and attract them to play games thereby helping games go viral. The process is simple and saves a lot of money by recognizing which customers are capable of paying and targeting all your campaigns to attract this user base. A lot of segmentation is possible using this simple method of data mining.

Example: Suppose the variables that are most important in finding paying are – Age, Education and Salary.
β0 = 1 (the intercept)
β1 = 2
β2 = 3
β3 = 4
x1 = Age
x2 = Education in years above high school
x3 = Salary in dollars above 50000

The model can hence be expressed as:
Probability of conversion to paying customer = 1/1+e^-z (Z= 1 + 2 x1 +3 x2+ 4x3 )

With increase in age, education and salary the probability of paying increases.
So, for a customer who is 24 years of age, has studied 7 years after high school and has a salary of 100,000 dollars the probability of conversion to paying customer would be 1/1+e^-z (Z= 1 + 2*10 +3 *7+ 4*50000 )

After understanding the segmentation of the customers and the probability of conversion to a paying customer, informed spending decisions can be made. Advertisements can be targeted to only to the segment desired and games can be designed to cater to the paying audience. 

List of territories/countries I have visited

Any one who knows me, knows that I love travelling. Here is a snapshot of the wonderful places I have visited till date. It's fun to mi...